Quicklinks
Search For an Instructor or Course
Hiring
Log in for official course staff hiringBrowse Instructors and Courses
- El Eng and Comp Sci Courses
- Electrical Engineering Courses
- Computer Science Courses
- TAs/Instructors per Semester
More Information
Course Surveys
Course survey data for all undergraduate and graduate level EECS courses are available here.
There are hundreds of thousands of pages, so, although most aspects work fine, there may be errors of which we are unaware. If you spot an error, especially a missing class or professor, or have a suggestion for the site, please email www-coursesurvey@hkn.
At HKN, we believe that the data displayed and the way that the data is displayed is:
- An accurate reflection of a course and/or course staff member
- Usable and accessible by students in evaluating a course and/or course staff member
- Transparent for the general public to understand
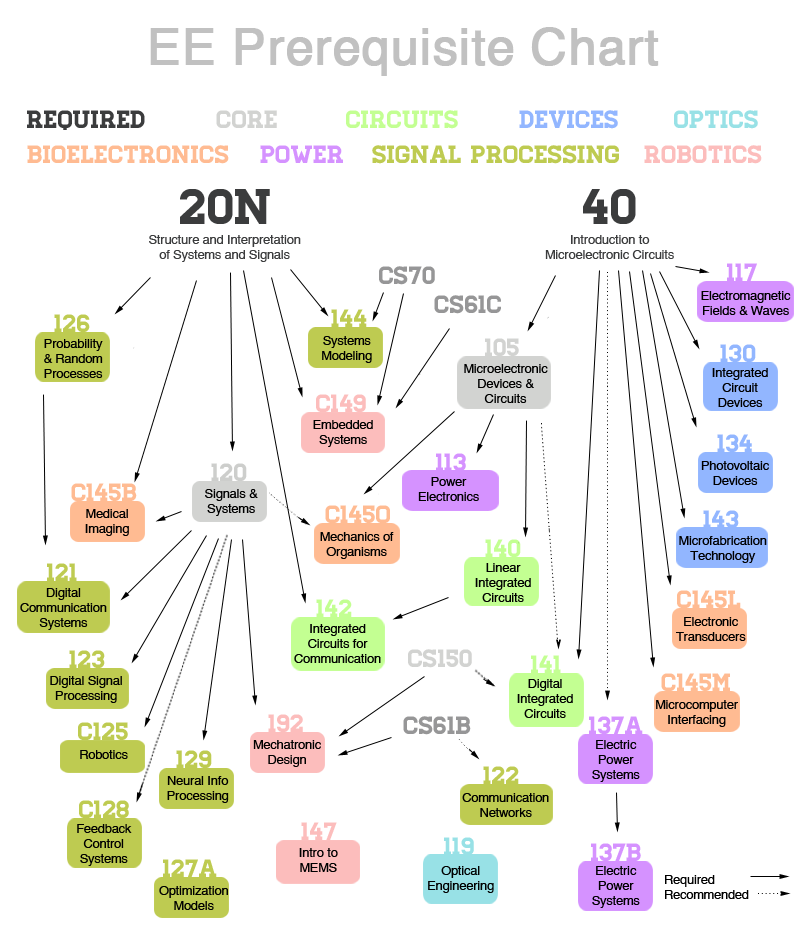
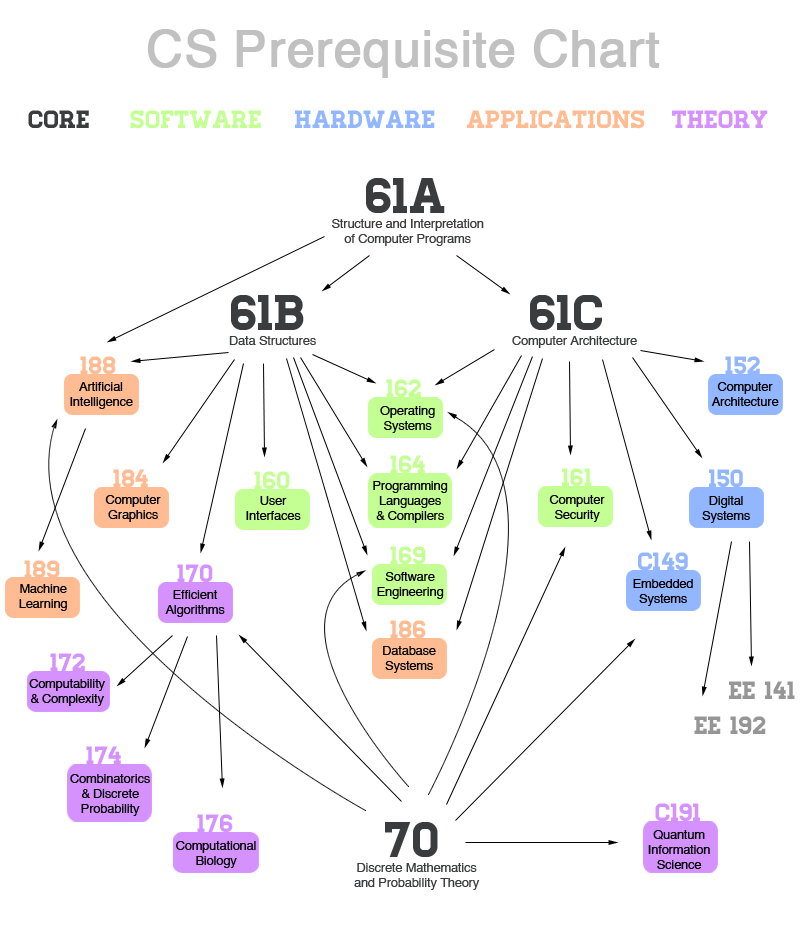
Prerequisite Charts
(Click on a course in the images below to see its ratings)